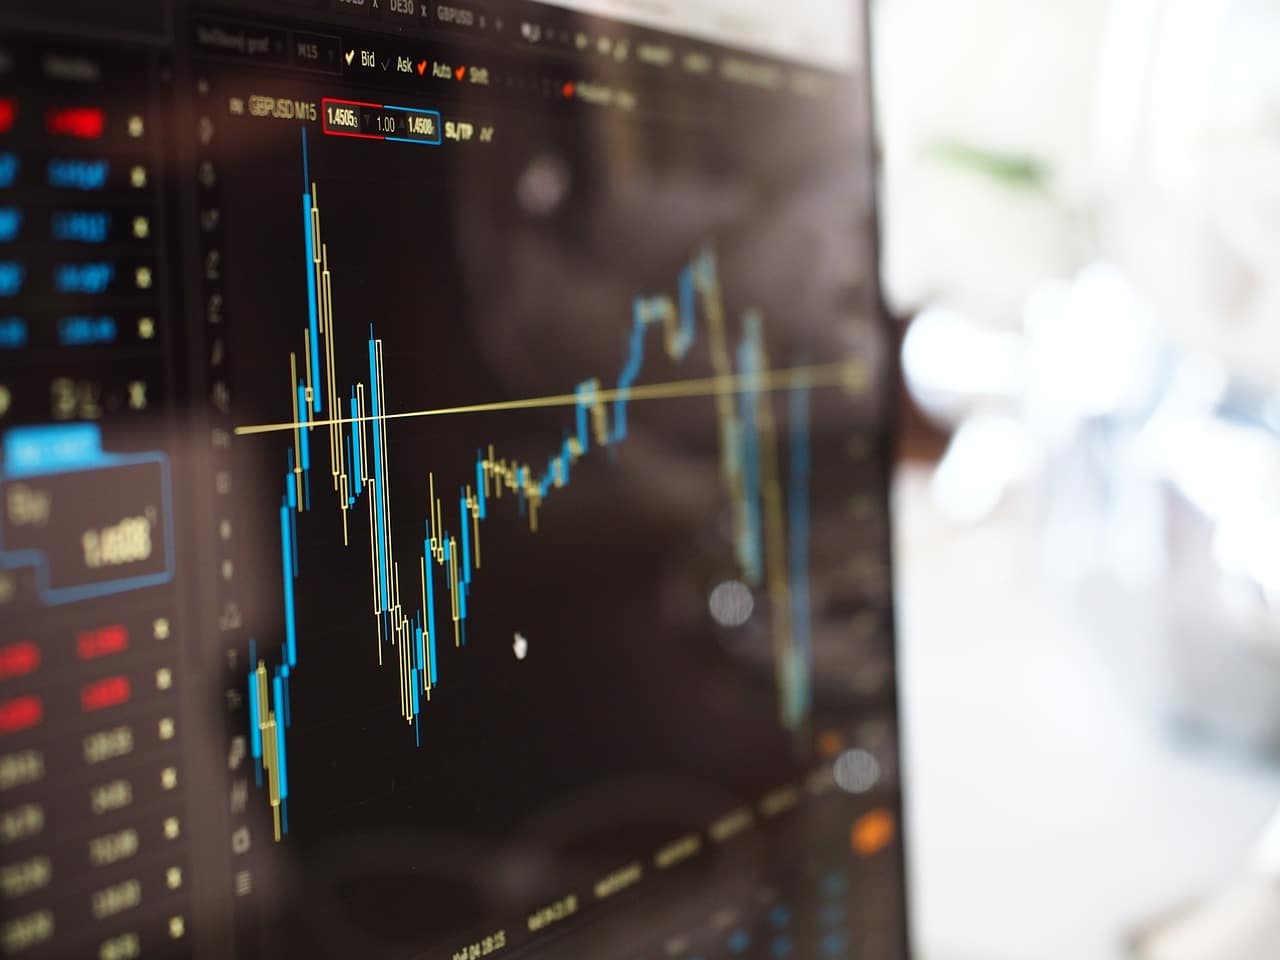
Ask any trader about the single most important thing required for trading. The answer would be the availability of real-time data. Financial markets are very dynamic and volatile, and, most importantly, they are fast-moving. This is why a tool that can provide you with all these dynamic and real-time features is crucial.
TradingView is one such tool that can be extremely handy for traders with its comprehensive range of features and resources for technical analysis that facilitate your online trading. Explore this blog further to find out how TradingView can help you master technical analysis!
What Is TradingView?
TradingView is simply a financial markets charting platform that comes with a diverse range of features such as customisable charts, indicators, alerts and real-time data about various financial instruments such as equity, forex, commodities and indices.
TradingView offers its users the option of selecting various timeframes for customized charts such as weekly, daily or hourly, making it one of the most reliable platforms for people who are keen on online stock trading.
How Does TradingView Help in Technical Analysis?
The most appealing attribute of TradingView is its versatility, as it caters to both novice and seasoned investors and traders. Technical analysis greatly depends on the market prices, trading volumes, and trends analysis.
Charting Tools
TradingView offers visual data in the form of various charts that make technical analysis easier because there is nothing better than visualising data in the form of charts! If you are a novice investor or trader, you can start with simple line charts and try identifying bullish or bearish patterns.
As and when your analysis and comprehension skills improve, you can explore the much more intricate tools such as Fibonacci retracements, Bollinger Bands and Renko Charts!
Technical Indicators
There are over 100 technical indicators that can prove to be extremely handy to seamlessly reflect the price trends of the market in a simplified manner. In addition, with the technical alert feature, you can stay notified of the targets you expect without spending your entire day monitoring them.
If you are having trouble understanding any aspect, there is a global community from which you can seek help, making it easier for you to master technical analysis!
Customized Strategies
While using TradingView, you can leverage Pine Scripts and curate custom programs and strategies that suit your needs. Additionally, this platform has incorporated drawing tools that allow you to annotate your charts while performing technical analysis.
TradingView’s user interface is extremely smooth and user-friendly, which means it is easy to navigate, use various features, and curate your ideal dashboards!
Conclusion
When it comes to trading, it is exceptionally crucial to analyse various charts to clearly understand the market sentiments as well as the perfect entry and exit positions, and this requires a dynamic and versatile platform that offers you all these features.
With a fusion of a broad range of indicators, alerts and charts, TradingView seamlessly blends modern technology with the finance community. With various forms and types of data being available, you can save time on assembling data and step up your trading game! To use TradingView for free, open an account with Dhan and utilize its broker integration.


